TOC
Survey response analysis based on Thanksgiving questionnaire from fivethirtyeight
Before getting started
Source of Data :
This data is gathered using a SurveyMonkey poll, they asked 1,058 respondents on Nov. 17, 2015 the following questions about their Thanksgiving
Read more about data set here and another report was done on this dataset by fivethiryeight Here’s What Your Part of America Eats On Thanksgiving.
The questions asked were
- Do you celebrate Thanksgiving?
- What is typically the main dish at your Thanksgiving dinner? Other (please specify)
- How is the main dish typically cooked? other (please specify)
- What kind of stuffing/dressing do you typically have? Other (please specify)
- What type of cranberry sauce do you typically have? Other (please specify)
- Do you typically have gravy?
- Which of these side dishes are typically served at your Thanksgiving dinner? Please select all that apply.
- Brussel sprouts
- Carrots
- Cauliflower
- Corn
- Cornbread
- Fruit salad
- Green beans/green bean casserole
- Macaroni and cheese
- Mashed potatoes
- Rolls/biscuits
- Vegetable salad
- Yams/sweet potato casserole
- Other (please specify)
- Brussel sprouts
- Which type of pie is typically served at your Thanksgiving dinner? Please select all that apply.
Apple
- Buttermilk
- Cherry
- Chocolate
- Coconut cream
- Key lime
- Peach
- Pecan
- Pumpkin
- Sweet Potato
- None
- Other (please specify)
- Buttermilk
- Which of these desserts do you typically have at Thanksgiving dinner? Please select all that apply.
- Apple cobbler
- Blondies
- Brownies
- Carrot cake
- Cheesecake
- Cookies
- Fudge
- Ice cream
- Peach cobbler
- None
- Other (please specify)
- Apple cobbler
- Do you typically pray before or after the Thanksgiving meal?
- How far will you travel for Thanksgiving?
- Will you watch any of the following programs on Thanksgiving? Please select all that apply.
- Macy’s Parade
- Macy’s Parade
- What’s the age cutoff at your “kids’ table” at Thanksgiving?
- Have you ever tried to meet up with hometown friends on Thanksgiving night?
- Have you ever attended a “Friendsgiving?”
- Will you shop any Black Friday sales on Thanksgiving Day?
- Do you work in retail?
- Will your employer make you work on Black Friday?
- How would you describe where you live?
- What is your Age
- What is your gender?
- How much total combined money did all members of your HOUSEHOLD earn last year?
- Which US Region do you belong to ?
Based on structure of the data, seeking to get answers for below based on dataset:
Based on structure of data, seeking to get answers for below based on dataset:
1. How Many people celebrate Thanksgiving & those who celebrate, what is the main dish ?
2. Difference between Rich & poor in celebrating thanksgiving ?
3. Does the choice of dessert & Pie fillings changes with Age ?
4. Which dishes often gets consumed together ?
Lets get started
1. Importing & Viewing collected Data
a. Viewing Sample Data 2. Exploratory Data Analysis
a. How Many people celebrate Thanksgiving & those who celebrate, what is the main dish ?
thx %>% count(celebrate)# A tibble: 2 x 2
celebrate n
<chr> <int>
1 No 78
2 Yes 980thx %>% filter(celebrate=="Yes") %>% count(celebrate,main_dish, sort=TRUE)# A tibble: 9 x 3
celebrate main_dish n
<chr> <chr> <int>
1 Yes Turkey 859
2 Yes Other (please specify) 35
3 Yes Ham/Pork 29
4 Yes Tofurkey 20
5 Yes Chicken 12
6 Yes Roast beef 11
7 Yes <NA> 6
8 Yes I don't know 5
9 Yes Turducken 3Clearly 92% of People celebrate Thxgiving so its a popular event, Also Turkey is really common main dish among those who celebrate(Obvsly), followed by Ham/Pork.
b. Is there a way how rich & poor celebrate thanksgiving (Using income from responses & converting to numeric, could be used for future analysis as well)
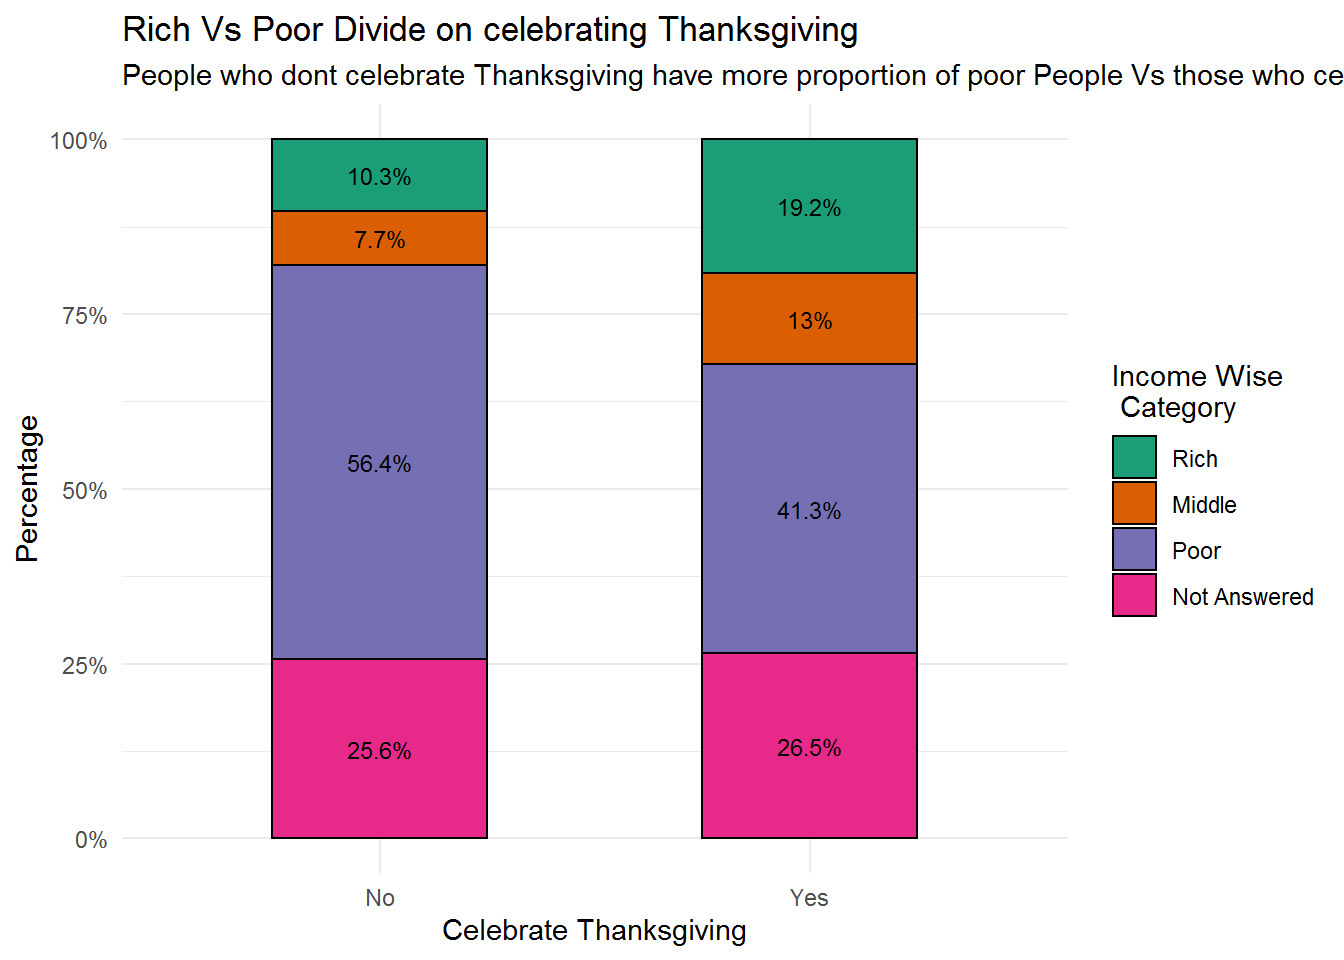
It can be observed that the category of people who dont celebrate Thanksgiving have more proportion of poor People Vs those who celebrate\n 56.4% Vs 41%
c. Does the choice of dessert & Pie fillings changes with Age
# A tibble: 5 x 2
  age         n
  <chr>   <int>
1 45 - 59   286
2 60+       264
3 30 - 44   259
4 18 - 29   216
5 <NA>       33
Interactive Treemap showcasing Dessert preference across various age groups
interThough Ice-cream remains a popular dessert across age group, interesting to see that younger age groups prefer cookie Vs their older counterparts who prefer Cheesecake
d. Which dishes often gets consumed together
<environment: R_GlobalEnv><environment: R_GlobalEnv>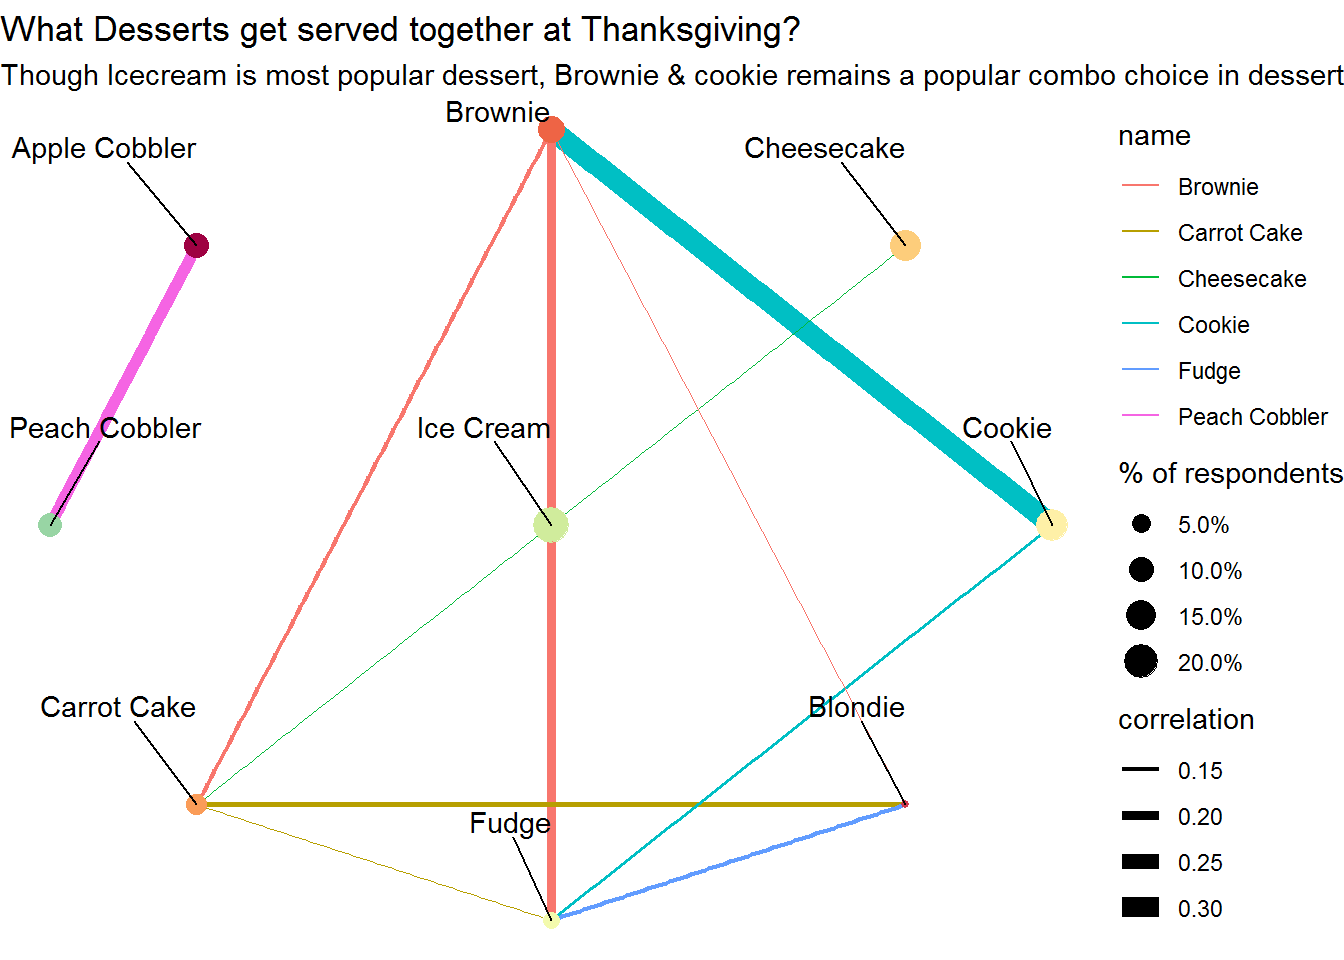
Figure 1: Desserts that gets served together
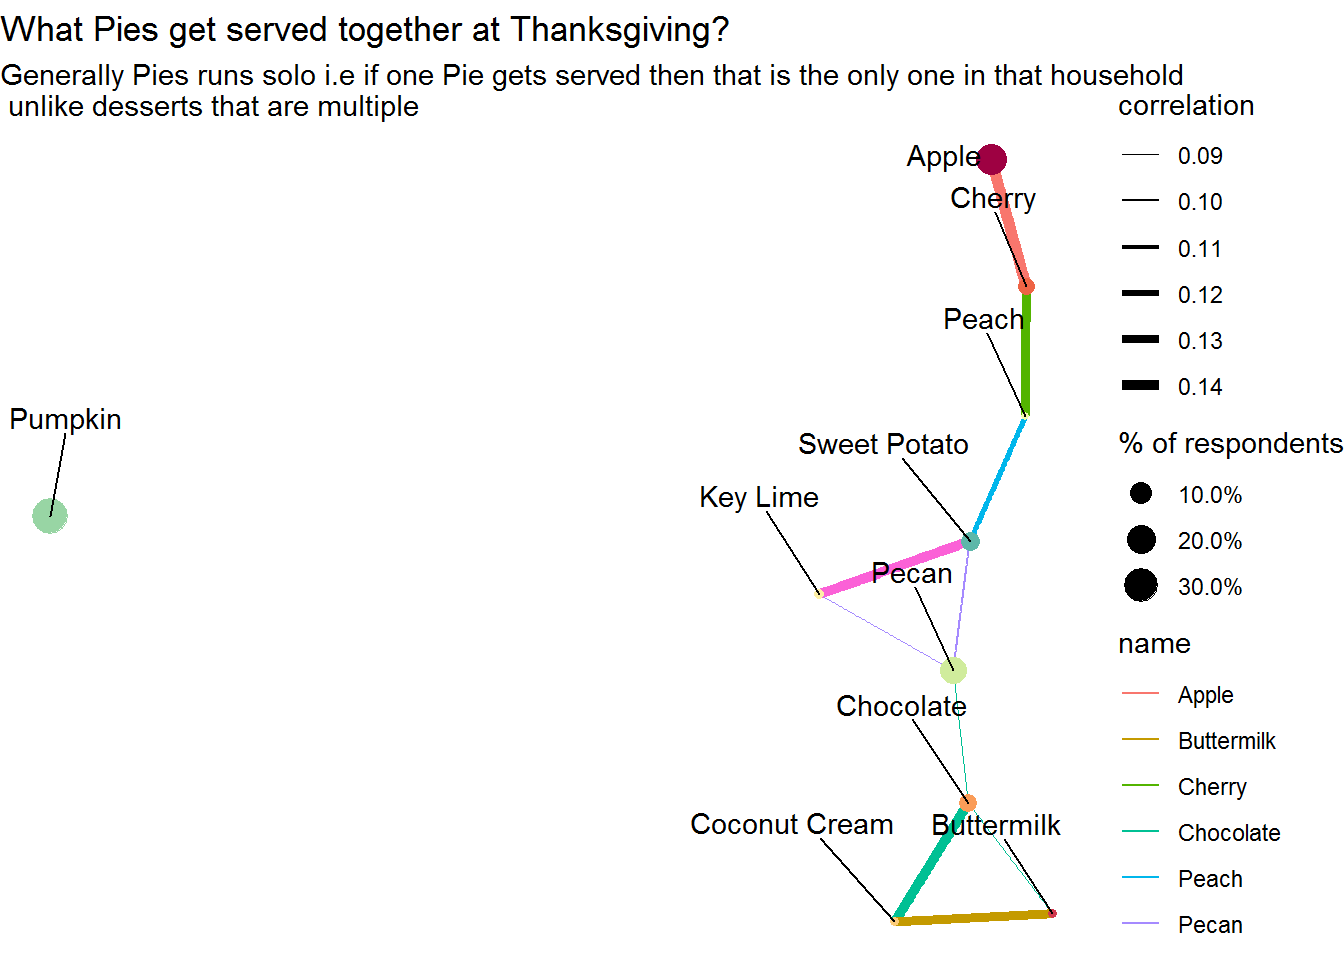
Figure 2: Pies that gets served together
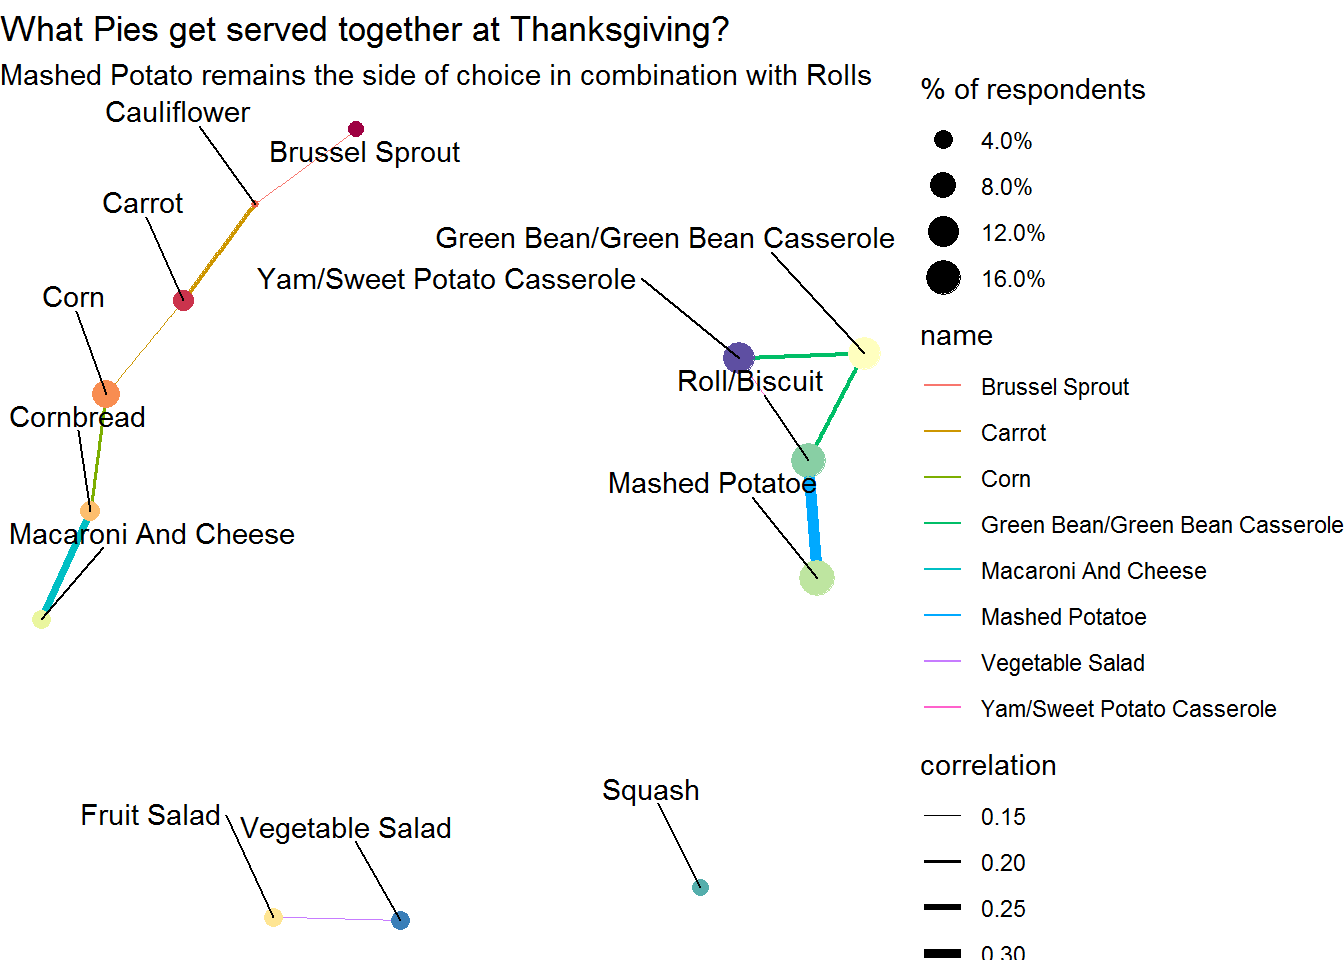
Figure 3: Sides that gets served together
comments powered by Disqus