TOC
The Office - US Version
Before getting started
Source of Data :
These are the official transcripts from The office TV Show - US Version. Read more about the scrouce of data here
Based on structure of data, seeking to get answers for below based on dataset:
* 1. How long did it last ? Episodes per Season <br> 2. Whose line is it anyway? Whose said how many lines per season*
Lets get started
Viewing raw data
1. Lines Per Episode
Roughly 300 lines on an average per episodes which covers up a 20 minute viewing slot. That gives us 15 lines per minute i.e A line every 4 second.
jet.colors <- colorRampPalette(c("#F0FFFF", "cyan", "#007FFF", "yellow",
                                 "#FFBF00", "orange", "red", "#7F0000"), bias = 2.25)


p_anim <- office %>%
  count(season,episode, name = "Lines Per Episode") %>%
  mutate(season=as.numeric(season)) %>%
  ggplot(aes(x = season, y = episode, fill = `Lines Per Episode`)) +
  geom_tile(color = "white", size = 0.35) +
  scale_x_continuous(breaks = seq(1,9,1)) +
  scale_fill_gradientn(colors = jet.colors(16), na.value = 'lightblue') +
  theme_minimal() +
  transition_time(season) +
  shadow_mark() +
    labs(x = "Season", y = "Episode", fill = "Lines Per Episode", title="The Office - Lines Per Episode Per Season", subtitle="As we can see here, that most of the episodes which were shot as two part had max lines (obvsly), apart from this Season final episodes had long lines\nFew Interesting observation that season 5,6,7 had most episodes & season 4 had 4 back to back 2 parter episodes!")
  #annotate(geom = "text", x = 1963.5, y = 50.5, label = "Vaccine introduced", size = 5, hjust = 0) +
  #geom_vline(xintercept = 1963, col = "black") +


animate(p_anim, width = 800, height = 600, end_pause = 90)
Figure 1: Lines Per Episodes from the TV show Office
2. Which character had maximum lines Season Wise I would be using two plots to convey same information, first is the evergreen split column chart, quite intuitive & really simple to see. Have used this in past too a lot of times, second plot is what I would be doing for the first time in posts, its called waffle plot (I know, really). That plot is what I have seen used increasingly nowadays as it creates a boring column chart into a brand new Waffle chart :D. Personally I think its just the name that gives it the Zing!
office %>%
  group_by(season) %>%
  count(character) %>%
  mutate(per=(n/sum(n))) %>%
  top_n(12,n) %>%
  ungroup %>%
  mutate(character = reorder_within(character, n, season)) %>%
  #ungroup() %>%
  ggplot(aes(character,n,fill = season))+
  geom_col(show.legend = F)+
  coord_flip()+
  facet_wrap(~season, scales="free_y")+
  theme_minimal()+
  geom_text(aes(label=scales::percent(per)),hjust = -0.01,check_overlap = TRUE)+
  scale_x_reordered() +
  scale_fill_brewer(palette=c("Paired"))+
  labs(y = "Number of Lines per Season",
         x = NULL,
         title = "The Office - Whose Line is it anyway ?",
         subtitle = "Michael leading the charts in terms of lines till season 7 post which the distribution among lines has lost the skewness ")+
   theme_classic()+
  theme(strip.background =element_rect(fill="#09b7d6"))+
  theme(strip.text = element_text(colour = 'white'))
office %>%
  group_by(season) %>%
  count(character) %>%
  mutate(per=(n/sum(n))) %>%
  top_n(3,n) %>%
  ungroup %>%
  #mutate(character = reorder_within(character, n, season)) %>%
  #ungroup() %>%
  ggplot() +
  geom_waffle(aes(fill = character, values = n),
              color = "white", n_rows = 50, flip = T,show.legend = TRUE)+
  facet_wrap(~season)+
  #coord_equal()+
  labs(y = "% of Lines per Season",
         x = NULL,
         title = "The Office - Whose Line is it anyway ?",
          subtitle = "Michael leading the charts in terms of lines till season 7 post which the distribution among lines has lost the skewness ")+
   theme_classic()
Figure 2: Waffle chart to represent whose line is it anyway ?
  # theme(strip.background =element_rect(fill="#09b7d6"))+
  # theme(strip.text = element_text(colour = 'white'))
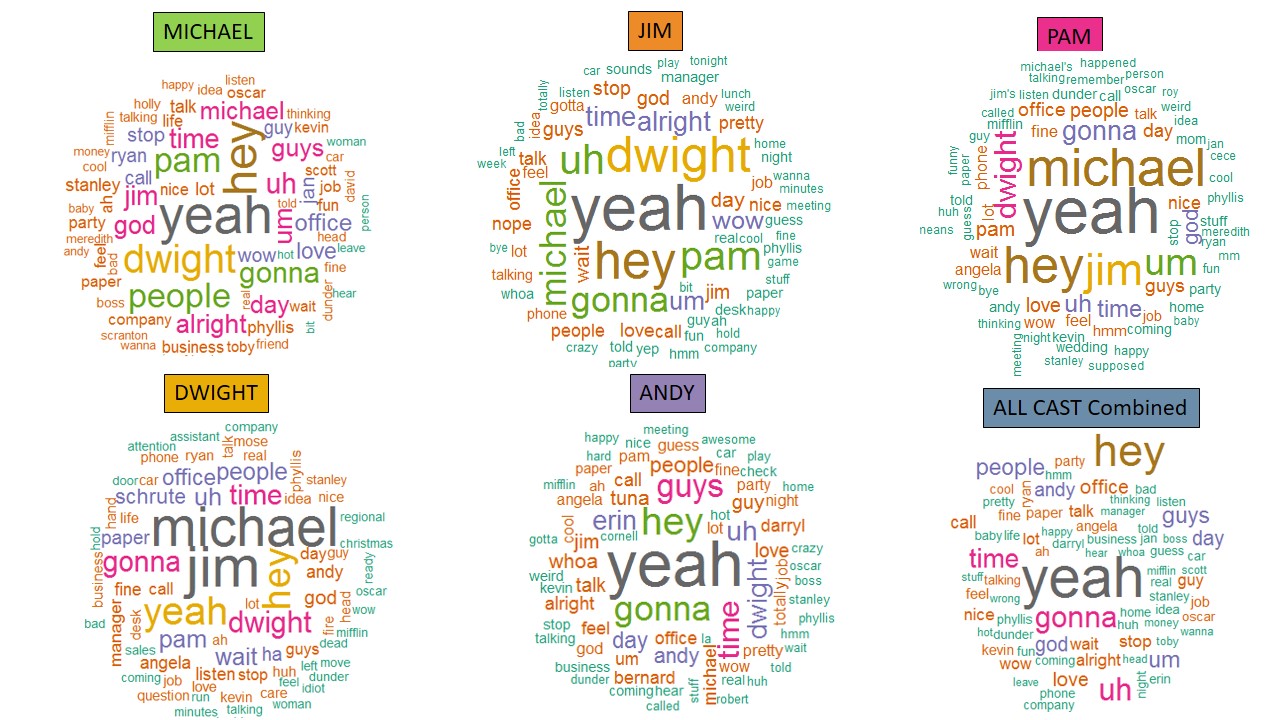
Text Analysis of the office transcript. This is the exciting part and something where I would be exploring more than something that meets the eye. I mean who knows what phrase Michael said more apart from “Thats what she said !”. Lets get rolling
3. Which words were most used in the office all seasons

Who said what the most ?
office %>%
  unnest_tokens(word, text) %>%
  anti_join(stop_words) %>%
count(word, sort=TRUE)## # A tibble: 19,225 x 2
## word n
## <chr> <int>
## 1 yeah 2895
## 2 hey 2189
## 3 michael 2054
## 4 dwight 1540
## 5 uh 1433
## 6 gonna 1365
## 7 jim 1345
## 8 pam 1168
## 9 time 1129
## 10 guys 933
## # ... with 19,215 more rowscomments powered by Disqus